Işık IEEE Computer Society · Workshop guide · about 12 min read
Bringing AI to Financial Data
Step-by-step written guide to the 2 h 15 min hands-on PyTorch workshop · Omar Elcircevi
Işık IEEE Computer Society PyTorch workshop — training an LSTM from scratch on Borsa Istanbul and global market data, the one-day-lag surprise, checking for data leakage, and direction classification.
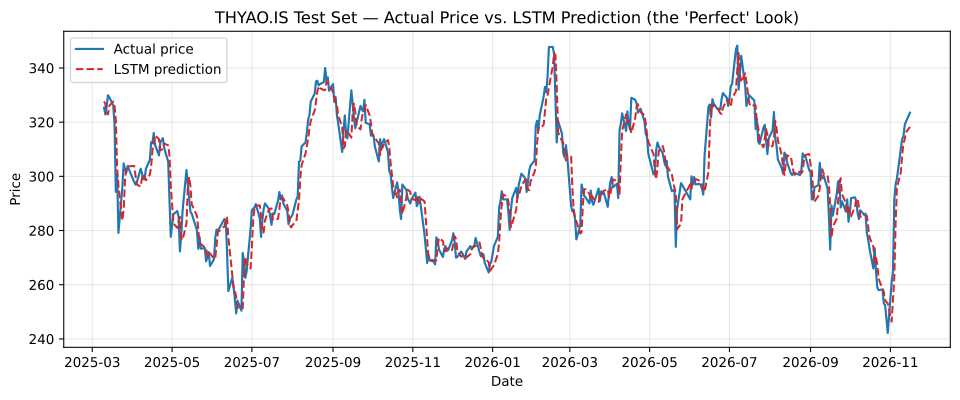
Deep learning on financial time series is full of traps: models that look "perfect" at first glance but are really just copying yesterday's price. In this 2 hour 15 minute hands-on workshop we build a PyTorch training loop from scratch on Borsa Istanbul (THYAO.IS, ASELS.IS, XU100.IS) and global market (BTC-USD, AAPL) data. We debunk the price-prediction illusion with a naive baseline ("tomorrow = today"), then reframe the problem, without data leakage, as direction classification. You leave with a clean PyTorch time-series template tested with honest metrics (walk-forward validation and a backtest with trading costs).
Important (Not Investment Advice): All code, models and analysis in this guide and the workshop notebooks are for machine learning and PyTorch education only. Nothing here is investment advice, and these models must not be used as real trading tools.
Prerequisites:
- A laptop and a regular Google account for Google Colab (nothing to install locally; the free CPU runtime is enough).
- Basic Python and
pandas; you do not need to have written a PyTorch training loop before.
Notebooks:
- Starter notebook (the one we fill in together during the workshop): Open in Colab
- Solution notebook (reference with all code and outputs filled in): Open in Colab
How the notebooks help you: each ✏️ TODO cell ends with a ✅ check that tells you whether your code is right, and what to fix if not. In the starter notebook a collapsed 💡 Hint and 👀 Solution sit under every TODO, and the 🔄 Catch up cell at the start of each part rebuilds everything up to that point.
Schedule (Wednesday 18 November 2026, 16:30–18:45 · DMF-214):
| Time | Part | What we do and learn |
|---|---|---|
| 16:30–16:40 | Part 0 · Intro (Hook) | A first look at the "perfect" price prediction from Part 4: "Could we make money with this chart?" |
| 16:40–16:55 | Part 1 · Setup and Data | Downloading THYAO.IS, the snapshot fallback, OHLCV and adjusted prices on a chart. |
| 16:55–17:15 | Part 2 · Cleaning and Features | Missing values (ffill), log returns, moving average, volatility, RSI, a chronological 70/15/15 split and a leak-free StandardScaler. |
| 17:15–17:35 | Part 3 · PyTorch Basics | Tensor, a 30-day SlidingWindowDataset, DataLoader, the nn.LSTM architecture, tensor shapes at every step and the training loop. |
| 17:35–17:45 | Break | 10-minute tea and coffee break. |
| 17:45–18:05 | Part 4 · Price Prediction and the Surprise | Next-day price prediction, MAE/RMSE against the "tomorrow = today" naive baseline, and the one-day lag analysis. |
| 18:05–18:25 | Part 5 · The Right Setup | Next-day direction classification on return features (BCEWithLogitsLoss), a majority-class baseline and 4-fold walk-forward validation. |
| 18:25–18:40 | Part 6 · Challenges | Your own ticker, a volume feature, GRU and TinyTransformer models, a backtest with trading costs (15 bps). |
| 18:40–18:45 | Part 7 · Wrap-up | Three takeaways, what real quant teams do differently, and resources. |
Workshop parts
- PART 1 · 1 MINSetup and DataDownloading THYAO.IS, the snapshot fallback, OHLCV and adjusted prices on a chart.
- PART 2 · 2 MINCleaning and FeaturesMissing values (ffill), log returns, moving average, volatility, RSI, a chronological 70/15/15 split and a leak-free StandardScaler.
- PART 3 · 1 MINPyTorch BasicsTensor, a 30-day SlidingWindowDataset, DataLoader, the nn.LSTM architecture, tensor shapes and the five-step training loop.
- PART 4 · 2 MINPrice Prediction and the SurpriseNext-day price prediction, MAE/RMSE against the 'tomorrow = today' naive baseline, and the one-day lag analysis.
- PART 5 · 1 MINThe Right SetupNext-day direction classification on return features (BCEWithLogitsLoss), a majority-class baseline and 4-fold walk-forward validation.
- PART 6 · 1 MINChallengesYour own ticker, a volume feature, GRU and TinyTransformer models, and a backtest with trading costs (15 bps).
- RESOURCES · 1 MINFurther Reading and ResourcesOfficial PyTorch documentation, time-series validation (TimeSeriesSplit) and data-leakage resources.